There are many tools available in the market to check and analyze the website's code. However, today, I will share one new with all of you. YES, IT IS PhpMetrics. PhpMetrics uses D3 as well as other cool analysis algorithms to check and scan our application's code and provide output according to that. As a PHP Developer, It is very necessary to check and test our code quality for extensive PHP Web Application Development.
Symfony Report :-
Analysis :-
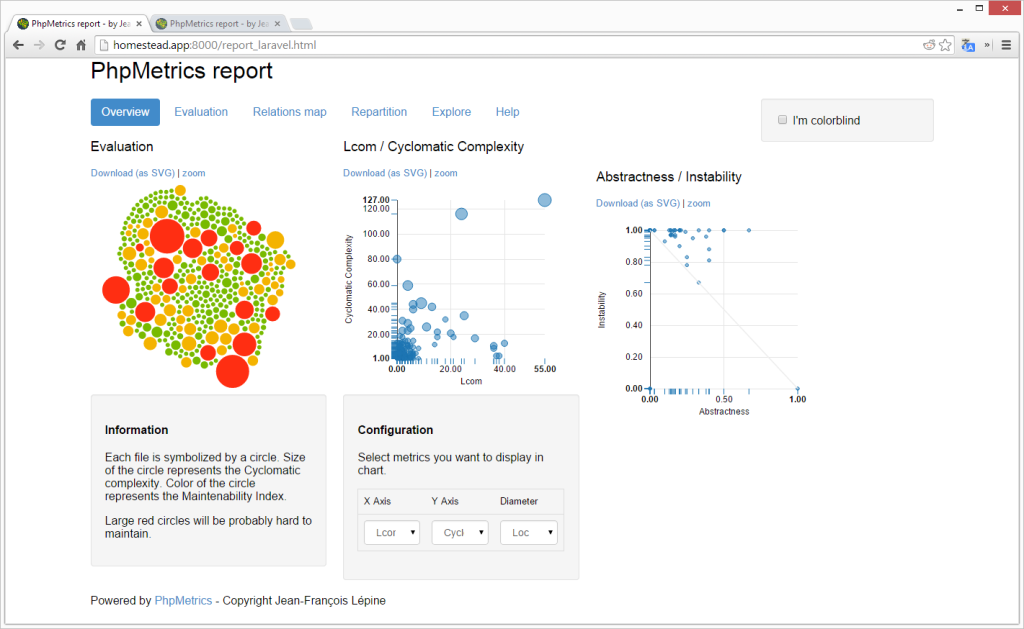
PhpMetrics offers a plethora of metrics. Let’s clarify those circles and graphs to check out what we are looking for.
Tables Format :-
Check out the data in a tabular form, check out the "Explore" tab in the below report.
In above table, all are there including lines of codes and classes per file as well as a folder. Check out this report, when you need very important information about your code all in one place.
Let's Move to the Custom Chart :-
Here, Laravel is more developers friendly.
Repartition :-
Check out the repartition screen which includes all the data in a very much simple format than explore tab.
Symfony :-
Laravel :-
Comparison of both the Result :-
1. Laravel is more user-friendly, light weight as well as less bloated in file size.
2. Symfony is three times more in weight, including classes, methods, files, line of code.
3. Laravel is much stable than Symfony.
4. Symfony is more complex than other.
Reference :- http://www.sitepoint.com/visualize-codes-quality-phpmetrics/
Installation of PhpMetrics :-
Let's understand every part with an example. It would be easy to get into it.
Required Environment :-
Isolated environment is a necessary to test it. So, make sure all users have the same environment to test it easily.
How to install PhpMetrics?? :-
Installation is a very easy. There is a need to install it globally. So, It will be available for all projects on the same machine.
1. sudo composer global require 'halleck45/phpmetrics'
Fetching of the Code :-
We will test PhpMetrics on two code-heavy projects :- First is Laravel, and Second is Symfony.
1 git clone https://github.com/symfony/symfony symframe
2 git clone https://github.com/laravel/framework lframe
PhpMetrics on a Code-Heavy Project :-
Now, let's run PhpMetrics on a downloaded project.
1 mkdir Laravel
2 mkdir Laravel/public
3 phpmetrics --report-html=/Laravel/public/report_symfony.html symframe
4 phpmetrics --report-html=/Laravel/public/report_laravel.html lframe
Here, I use "Laravel” folders to reduce the configuration steps. This lets us easily access the reports at the following URLs:
1. homestead.app:8000/report_symfony.html
2. homestead.app:8000/report_laravel.html
Laravel’s Report :-
Analysis :-
PhpMetrics offers a plethora of metrics. Let’s clarify those circles and graphs to check out what we are looking for.
Tables Format :-
Check out the data in a tabular form, check out the "Explore" tab in the below report.
In above table, all are there including lines of codes and classes per file as well as a folder. Check out this report, when you need very important information about your code all in one place.
Let's Move to the Custom Chart :-
We are comparing the ratio of CC and Lcom for every single file. Here, you can check that, Laravel’s trend is proportional – with more LoC & Difficulty, while Symfony tends to be all over the place with certain files.
For example, the Symfony file BinaryNode.php has a too much difficulty for 150 lines of code, while Response.php has a low difficult which has 1275 lines of code. Explore the files that create more curious results, and see what you can find out from those.
Evaluation :-
This is a web chart which takes the average of different attributes of your whole project, Compare these numbers to the standard of other projects the tool has learned and evaluate your values over those.
Here, Laravel is more developers friendly.
Repartition :-
Check out the repartition screen which includes all the data in a very much simple format than explore tab.
Symfony :-
Laravel :-
Comparison of both the Result :-
1. Laravel is more user-friendly, light weight as well as less bloated in file size.
2. Symfony is three times more in weight, including classes, methods, files, line of code.
3. Laravel is much stable than Symfony.
4. Symfony is more complex than other.
Reference :- http://www.sitepoint.com/visualize-codes-quality-phpmetrics/


0 comments:
Post a Comment